
| Rob Hawley's Pages | Almaden Observatory Main Page |

|
|

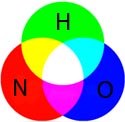
| Filter |
Exposure |
|---|---|
| Hydrogen | 22x900 |
| Oxygen | 20x900 |
| Nitrogen | 22x900 |
| I thought it might
be interesting to fully document what I did. The image you see at
the right is what the image looked like after combining the 3
channels. While there are some hints at details to be
revealed for the most part the image is flat and boring.
This section will describe the steps I did to convert that into what
you see above. Please also refer to the discussion in the Heart and Soul Nebula. A number of the strategies are discussed there. Processing has three major steps:
|
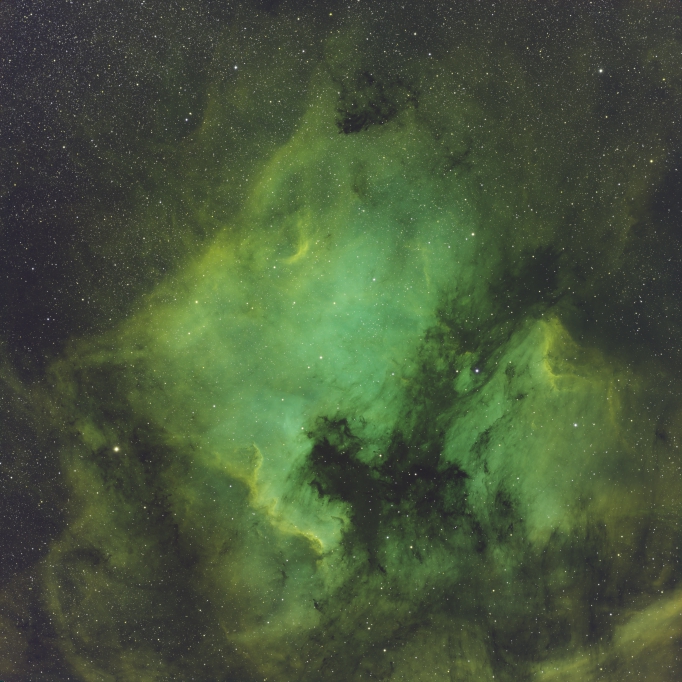 click for a larger image |
| Operation |
Mask |
Modification |
|---|---|---|
| Channel Combination |
- |
Join the merged Nitrogen,
Hydrogen, and Oxygen together to form RGB image |
| Background Neutralization |
- |
Set the background levels the
same for each color. The background is now black |
| ColorCalibration |
- |
Adjust the levels of the three
channels to make "white". In this case I set the foreground
sample to be several areas of the nebula. CC then adjusted the levels
of each of the three channels. |
| Curves |
~starmask4 - this mask is made
of of several star masks. It tries to include a sharp image of
dim stars and more expanded images of brighter stars. This
reduces the impact of this step on the star images |
Increase the saturation of the
image. This intensifies the colors |
| Curves |
starmask4 |
removes any color in the images
of the stars by setting the saturation to zero. |
| ImageSolver |
- |
Determine the location of the
image and set the FITS parameters. Important later when I try to
annotate it. |
| Operation |
Mask |
Modification |
|---|---|---|
| HistogramTransformation |
- |
This step remaps the intensities
of the original. This increases
the intensities
in the original image so the details are now brighter. Think of
this as curves on steroids. |
| HDRMultiscaleTransform |
This mask is a combination of a
stretched version of the intensities minus a mask of the stars.
This is done so more of the effect applies to the brighter sections of
the image, but not the stars |
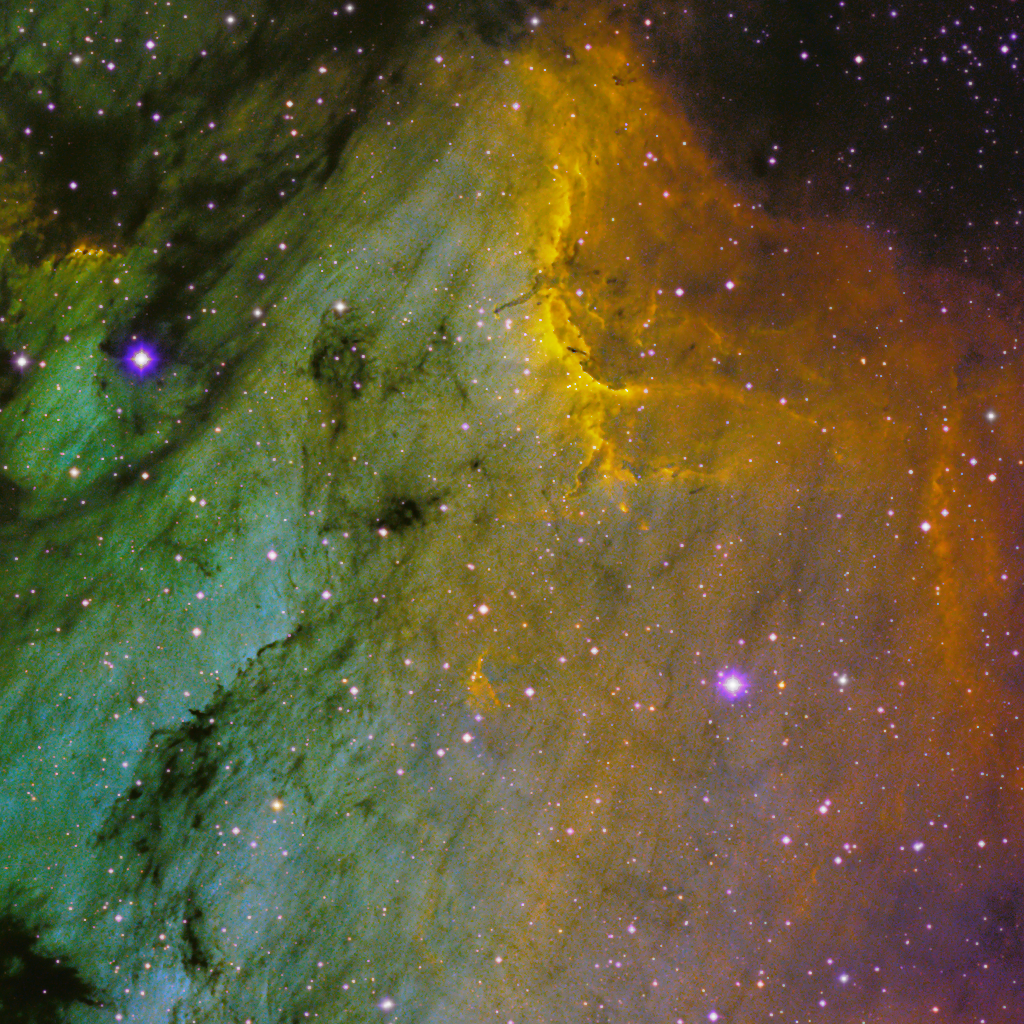
This step brings out the subtle
structure by remapping the intensities to bring out the structures
hidden in the data. At this point the two walls in "Mexico" and
the Pelican become more obvious. This is a
writeup on a previous version of this algorithm. |
| Curves |
Another mask that allows the
bright areas to be modified, but protects stars |
HDRMultiscaleTransform results
in an image that is rather flat looking since it spreads the
intensities over a larger range. To fix this the saturation and
luminance need to be increased. One needs to be careful so important
details are brighter, but not saturated. One also wants to
increase not kill the contrast of the image. |
| Fix bright star |
Masks for the two brights stars |
Two particularly bright stars
were repaired at this point. I used PixelMath to replace the
image of the star with a copy earlier in the processing. I then
desaturated the star to remove color |
| MultiscaleMedianTransform |
bright areas minus stars |
This is the first
sharpening. MMT works with wavelets. I selected certain
sizes of structures to be enhanced and others to be noise reduced. |
| MultiscaleMedianTransform | midtones |
Now sharpen and enhance the
midtones of the image |
| Curves |
everything not a star |
again tweak the intensities and
saturation |
| TGVDenoise |
~ bright areas |
Apply noise reduction.
Mostly applied to the dimmer areas (brighter areas were done above) |
| DarkStructureEnhance |
generates its own masks |
Brings out the dust lanes by
finding and enhancing any dark/bright boundaries |
| Curves |
shadows |
lower the intensity of the
shadows. Adds contrast to the image |
| Curves |
again a gentle tweak of
intensity and saturation |
| Operation |
Mask |
Modification |
|---|---|---|
| ColorSaturation |
mask for 62cyg |
I was still not happy with the
brightest star. Since the color of the halo was mostly purple I
selectively removed reds and purples. Other colors were
untouched. The result was that the diffraction spikes were now
white. |
| Convolution |
starmask |
Some of the operations above
made the stars have very sharp edges. In this step I gently
blurred the stars so they looked more star-like. |
| MorphologicalTransform |
mid brightness stars |
The mid level stars looked
unnaturally large. With this I reduced their size a bit. |
| ColorSaturation |
mid brightness stars |
remove the final bit of purple shadow where needed. |
