M 52 and Bubble Nebula Area
June
2014 - July 2014
July 2017 - September 2017
The Hydrogen image for this area was the first panel in what became a huge
project to map the Sharpless regions of Cassiopeia to Cygnus.
For the next two seasons I concentrated on filling out that mosaic with some
notable diversions such as NGC 7000
(North American). After the eclipse I decided to return to M 52
(my panel 1 of the mosaic) and see if I could shoot some O and S to go with
the H. Once I got the data I was underwhelmed with the S image.
So I quickly took some Nitrogen exposures. These proved to be more
interesting.
In most narrowband images of this object the "Hydrogen" component is
actually H + Nitrogen. The Nitrogen line is close enough to the H
alpha line that it requires a 3 nm filter like I am using to separate the
two. Doing so opens the possibility of viewing a nebula in a different
way. Note that the Hubble also uses 3 nm filters so their Hydrogen is
just Hydrogen.
Since neither the O or the S was a very strong signal I decided to combine
them using one part O and 2 parts S to create the Blue channel. The rest of
the processing is discussed below.
Location of Image
M 52 is located between the W of Cassiopeia and the house of
Cepheus. I framed the image to capture several of the nearby
Sharpless objects which include the Bubble Nebula (NGC 7635).

Above is a map in Alt Az as viewed from the Observatory.
Annotated Image
The image is presented rotated so north is up. In this case the
lines are RA/Dec instead of Alt/Az.

M52 and Bubble
Here is M 52 and the Bubble at 1/2 resolution.

Zoomable Image in NH-OS2
The full size image is about 4096x4096. The following will allow the
reader to zoom into the image to explore it more closely.
Processing Details
Here are counts of the raw frames that were used for the various
filters. Naturally more images were taken. These represented the
ones that made the cut.
Filter
|
Exposure
|
| Hydrogen |
31x900 |
| Oxygen |
20x900 |
| Nitrogen |
19x900 |
| Sulfur |
15x900 |
All images were processed by Pixinsight.
Since Hydrogen is much much stronger than any of the other signals I had to
dial it back so the image did not end up Green. Each of the channels were
linear fit to the Hydrogen. They were combined with PixelMath
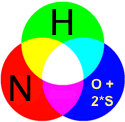
	Red = Nitrogen
	Green = Hydrogen
	Blue = Oxygen + 2 * Sulfur
During Color Calibration the Hydrogen signal was reduced to 31% of the original signal. The colors were then adjusted to bring the colors closer to saturation. Not only does this make for a more interesting image, it highlights the different distributions of the elements in the nebula. The red areas really are areas where there is more Nitrogen. Of course there would be even more Hydrogen had I not intentionally reduced its signal.
Note the region of SH 2-157 that is poor in Nitrogen, but contains Oxygen and Sulfur as well as Hydrogen. This shows that the Nitrogen and Hydrogen filters really are capturing something different.
A number of dark nebula appeared when I used Dark Structure Enhancement.
Copyrights For Photos 
(c) 2017 Robert J Hawley.
Except as noted,all work on this site by Robert J. Hawley is copyrighted
under a Creative
Commons
Attribution-Noncommercial-Share Alike 3.0 United States License. This
permits the non commercial use of the material on this site, either in whole
or in part, in other works provided that I am credited for the work.
10/19/17
